Mindverse Suite: AI charts made easy

Graphics, tables, charts — we encounter data visualization everywhere, in the news, at work or at study, and although they are often very simple graphics that you read, it is surprisingly difficult to create them.

Graphics, tables, charts — we encounter data visualization everywhere, in the news, at work or at study, and although they are often very simple graphics that you read, it is surprisingly difficult to create them.
Datenvisualisierung dank KI einfach gestaltet.

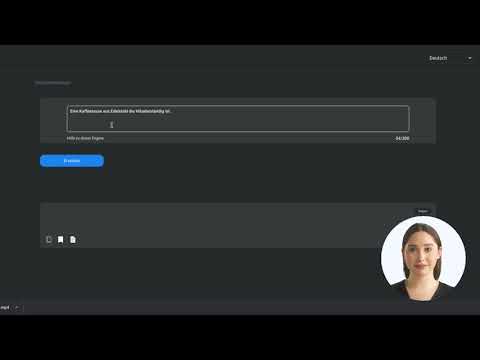
It's very simple. All you have to do is copy your data into an input field and press a button. The AI does the rest, processes the data and selects the appropriate plot type to create your diagram.
This means you only have to wait a few seconds for your chart, even if the data isn't formatted optimally. Mindverse Charts can also do even more: data research.
With data research, you ask Mindverse AI to search the Internet in search of suitable and freely accessible data about what you want to know.
Just tell the AI that you want a graph of CO₂ emissions per capita over the last 10 years and the AI will find the right data for you and, depending on your opinion, they can quickly create a nice graphic on the topic. This allows you to visualize thoughts and save time for more important things.
Die KI sucht für Sie die passenden Daten und erstellt innerhalb weniger Sekunden ein zu den Daten passendes Diagramm. Sie können das Diagramm bearbeiten, Quellen einsehen und exportieren.
Mindverse Charts can create 10 different types of charts for you, based on the data you provide. Of course, you can always choose a specific display type if you have a strong preference. We have summarized a few of the most important diagrams for you here:

Mindverse can of course create a few more charts for you. To find out exactly which charts Mindverse can create for you, simply log in and open the AI Charts Engine.
As a Premium and Premium Plus customer, you can then create suitable charts for your data directly or have data searched for using AI. From now on, you can visualize your data yourself.
Select a resource
The latest developments and breakthroughs in the world
of artificial intelligence
View all news

If you need help with Mindverse AI, read our FAQs to learn more
View all FAQs
At Mindverse Academy, you'll learn everything you need to know about our AI tools
View all tutorials